


Making Sense of the Market Run: Why This Isn't 2000 All Over Again
With the S&P 500 trading robustly above the 7,500 mark, it is completely normal to look at your portfolio, look at the charts, and feel a little bit anxious. We have enjoyed an incredible run, and the natural instinct for many retail investors is to wonder: Are we flying too close to the sun? Is a repeat of the dot-com crash right around the corner?
To answer these questions, we want to share some incredibly grounding data highlighted by Denise Chisholm, Director of Quantitative Market Strategy at Fidelity Investments, on a recent market podcast.
The short answer? The market looks entirely different fundamentally than it did during the 1999–2000 bubble, and the numbers tell us this rally still has legs. Here is a breakdown of why this market is built on solid ground.
1. Show Me the Money: Cash Flow vs. Hype
The biggest fear out there is that the current boom in artificial intelligence and tech infrastructure is a speculative bubble. But when you look at how this expansion is being funded, the contrast with 1999 is stark.
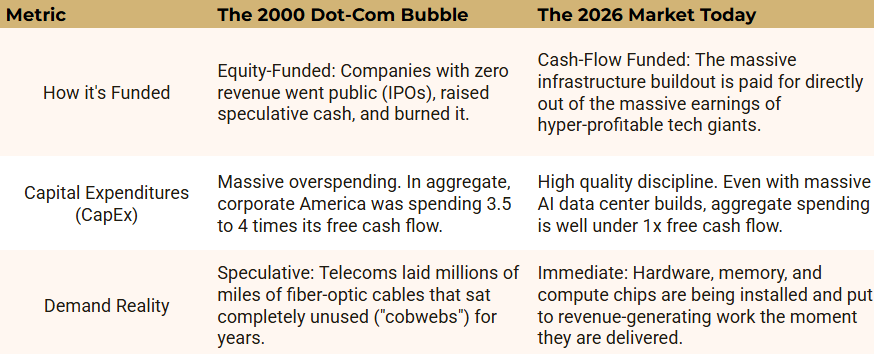
The Takeaway: In 2000, tech stock earnings actually peaked in 1996—meaning prices went up while profits went down for four straight years. Today, stock prices are going up because corporate earnings are compounding at historic rates. Investors are paying for real, realized profit, not just a promise.
2. The "493" Are Just Getting Started
For the last couple of years, it felt like a tiny handful of massive tech companies (the "Magnificent 7") were dragging the entire stock market higher on their backs. Meanwhile, the rest of the market—the other 493 companies in the S&P 500, along with smaller-cap companies—were stuck in a "corporate profit recession" as higher interest rates took a toll.
That script has officially flipped.
We are currently in a full-employment economic recovery where earnings growth is broadening out. The S&P 493 has only been in an earnings recovery for about four months. Historically, because the previous earnings slowdown lasted a full three years, quantitative cycles suggest this recovery has long-term structural durability. We are seeing a manufacturing and industrial capacity revival in the U.S. that is breathing fresh life into sectors outside of pure technology.
3. Fear is Actually the Fuel
Counterintuitively, the fact that so many people are worried about this market is exactly what keeps it moving higher. Wall Street calls this "climbing a wall of worry."
Because investors have been deeply skeptical about inflation and sticky interest rates, we have seen an environment of multiple compression—meaning corporate earnings have shot up so fast that they’ve actually outpaced stock price gains.
Denise’s historical quantitative data shows a fascinating anomaly: The more uncertain the macroeconomic environment, and the lower the general consumer confidence, the higher the historical odds of the stock market advancing. When fear is highly visible, the market has already thoroughly priced in the risks.
What This Means For Your Portfolio
It is easy to get distracted by speculative "sideshows" like meme stocks making headlines, but the core of the U.S. stock market remains incredibly disciplined, highly profitable, and supported by low unit labor costs and rising productivity.
We don't need a "perfect" economic environment with rapid interest rate cuts for stocks to move higher. Historically, gradual or small adjustments by the Federal Reserve are a reflection of economic growth—and a growing economy is the ultimate driver of stock market returns.
If you want to review your specific portfolio allocations or talk through how this expanding earnings cycle impacts your long-term retirement goals, let's connect.
Looking forward to chatting soon!
Jon